There are hundreds (if not thousands) of technical indicators. According to Google, Investopedia (the reference point for financial education) has hundreds of documented indicators. ChatGPG reports 100-200 as a core-set and a low thousand of documented ones. This begs the question: how to know what metrics to use.
Because there is no defined set of documented metrics, Trademinator will focus on the most popular ones; however, this is not enough. Although two metrics could measure the same aspect of a candlestick, there is a criterion to follow:
- The metric's range must be 0-1, 0-100, -1 to 1, or -100 to 100. If the range differs, a normalization function should be used to fit it.
- At a minimum, the indicator must indicate when to hold or when to trade; ideally, it should show when to buy or sell.
Why? Trademinator AI algorithms are distance-based classifiers. An indicator with no limit on its output may trigger a false result.
Trend Indicators
Momentum Indicators
Moving Average Convergence Divergence - MACD
Here https://www.investopedia.com/terms/m/macd.asp, we can read a detailed explanation of what the MACD indicator is. According to our selection criteria:
![]() The MACD doesn't have a fixed range; it fluctuates around the zero line.
The MACD doesn't have a fixed range; it fluctuates around the zero line.
![]() MACD can be used to know when to buy, when to hold, and when to sell.
MACD can be used to know when to buy, when to hold, and when to sell.
Percentage Price Oscillator - PPO
The PPO is a MACD variance that, instead of using absolute values, uses percentages. A detailed explanation of this indicator can be read here https://www.investopedia.com/terms/p/ppo.asp. According to our selection criteria:
![]() The PPO range goes from 0 to 100.
The PPO range goes from 0 to 100.
![]() PPO can be used to know when to buy, when to hold, and when to sell.
PPO can be used to know when to buy, when to hold, and when to sell.
Relative Strength Index - RSI
Investopedia has a very interesting article where the RSI indicator is very well explained here https://www.investopedia.com/terms/r/rsi.asp. According to our selection criteria:
![]() The RSI range goes from 0 to 100.
The RSI range goes from 0 to 100.
![]() The RSI output shows when to buy (close to zero), when to hold (close to 50), and when to sell (close to 100).
The RSI output shows when to buy (close to zero), when to hold (close to 50), and when to sell (close to 100).
Stochastic Oscillator - STO
As always, Investopedia has a very detailed article that fully explains the STO indicator is here https://www.investopedia.com/terms/s/stochasticoscillator.asp. According to our selection criteria:
![]() The STO range goes from 0 to 100in both %K and %D.
The STO range goes from 0 to 100in both %K and %D.
![]() The %K and %D's output can be used to signal when to buy (close to zero), when to hold (close to 50) and when to sell (close to 100).
The %K and %D's output can be used to signal when to buy (close to zero), when to hold (close to 50) and when to sell (close to 100).
Additionally, switching between %K and %D can be used as a trigger to know when the trending has changed.
Volatility Indicators
Exponential Moving Average - EMA
Tipical Price - TP
TR
CHOP
Simple Moving Average - SMA
Commodity Channel Index - CCI
ATR
ATRP
Smoothed Moving Average - SMMA
ADX
Awesome Oscillator - AO
Accelerator - AC
Bollinger Band - BB
Keltner Band - KB
Super Trend
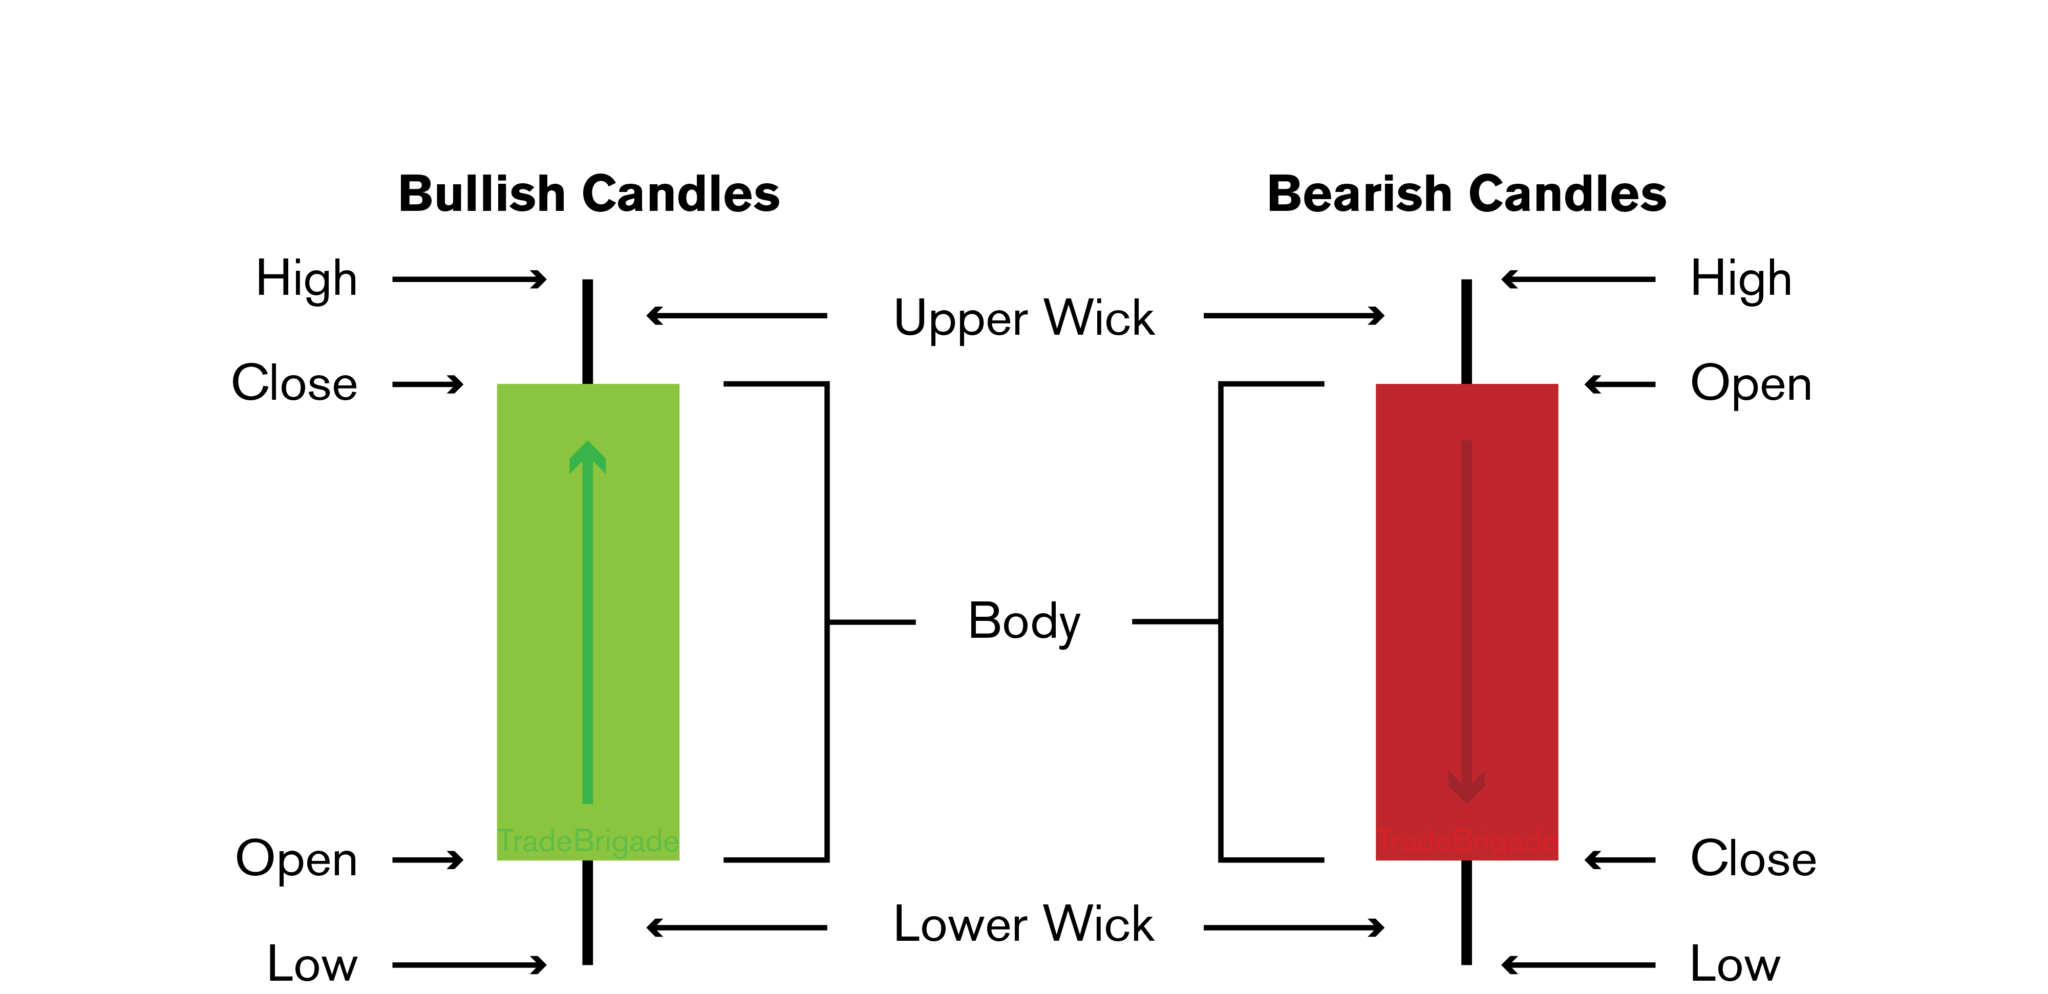
There are different ways to represent a candlestick. The most common is the green/red bar. Let's talk about it.